
Measurable ROI
Know what every share is worth
Measure campaign ROI by tracking every share from the first pageview to the final conversion. Analyze campaign growth all in one place.
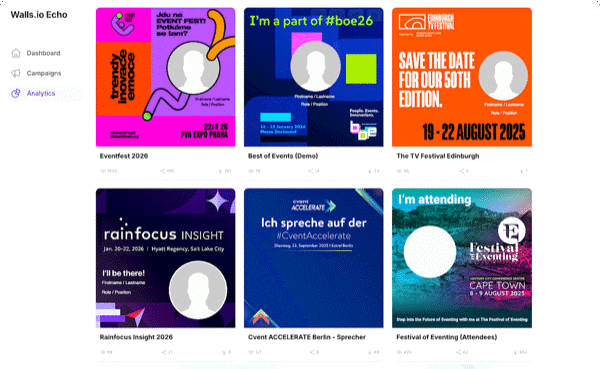
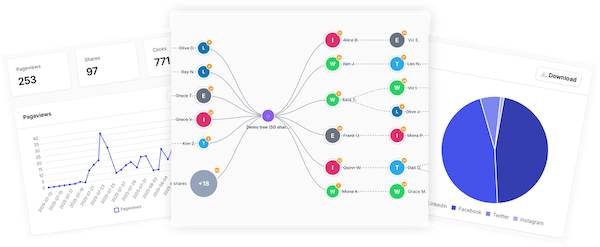
Analytics dashboard
Social sharing campaign analytics
The built-in analytics dashboard gives you the complete picture of how your campaigns perform. Filter by campaign and date range - every number, chart, and table updates instantly, and daily trend charts show how each metric evolves over time.
Pageviews
How often your sharing page receives a unique visit - so you can see how much traffic your campaign is actually getting.
Shares
Every completed share on every platform. Compare against pageviews to see the share rate your traffic actually generates.
Clicks
How many people followed up on a share. Every click is tied to the exact share that earned it - not just to the campaign.
Viral Boost
Clicks divided by shares - the core indicator of how effectively your campaign spreads. A boost of 5× means every share brought five visitors back.
Conversions
Registrations, ticket sales, purchases: every tracked conversion, attributed to the campaign, the platform, and the share that drove it.
Devices & platforms
See which devices your visitors use and on which networks your participants share - and prioritize accordingly in your next campaign.
Conversion & revenue tracking
From click to conversion
Paste one JavaScript snippet on your registration-confirmation or thank-you page, and Echo attributes every conversion back to the campaign, the platform, and the individual share that earned it.
-
One snippet, done
Copy the tracking code from your campaign settings onto your thank-you page. Restrict it to your own domains if you like by simply adding it to an allowlist.
-
Your UTMs, everywhere
Add custom UTM parameters to your campaign and every shared link carries them - so Echo traffic shows up cleanly in Google Analytics and the rest of your stack.
-
Revenue attribution
Put a value behind conversions to see what campaigns and sharers actually earn - and export the numbers for sponsor and exec reviews.
<script src="https://echo.walls.io/c1x9Fk2/tag.js"></script>
<script>Echo.track();</script>
Conversions
21
Value
Coming soon!
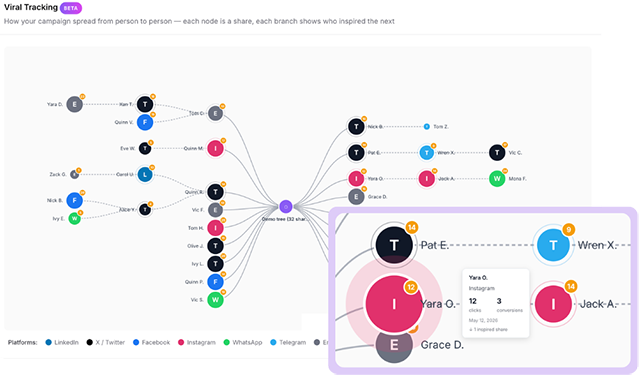
Viral tracking
See who inspired whom
The Viral Spread Tree visualizes how a campaign travels from person to person.
Follow the chain
When someone clicks a share and then shares themselves, the new share is connected to the one that inspired it - wave after wave.
Influence at a glance
Bigger circles mean more clicks, platform colors show where each share lives, and a ring marks shares that inspired further shares.
On when you want it
Viral tracking is opt-in per campaign - flip it on in the Tracking & Embed settings and every new click starts building the tree.
Per-sharer attribution
Find the people who move the needle
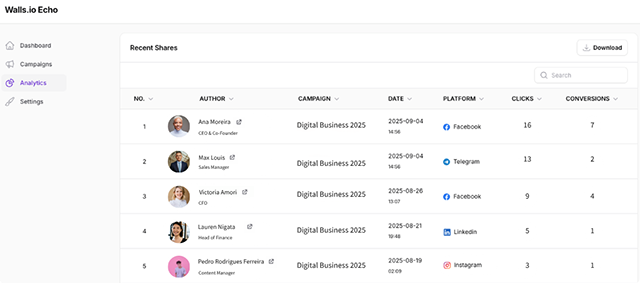
Every share is ranked with its author, platform, clicks, and conversions.
Every share, attributed
The recent-shares table lists each share with the sharer's name and role, the platform, and the clicks and conversions it earned.
Find your champions
The leadership list ranks sharers by the clicks their posts generate - perfect for spotting and rewarding your most influential advocates.
Sponsor-ready numbers
Show speakers, exhibitors, and sponsors exactly what their posts contributed - in numbers, not impressions.
Exports
Take the data with you
Every chart and table exports with one click: trend charts as CSV, XLSX, PNG, or SVG; breakdowns and the full shares table as CSV or XLSX - including all rows in your current filter, not just the visible page. Files are named after the metric, date range, and campaigns automatically.
Prefer to skip the downloads? The REST API serves every metric as clean JSON, and the MCP server lets AI assistants like Claude and ChatGPT query your campaigns directly.
Explore integrations & APIYour next event deserves an Echo.
Most event promotion tools charge more for less. Echo comes as a subscription or a one-time package that covers your whole audience — no per-user, per-share, or per-campaign charges. You get the full toolkit:
Subscriptions
starting at
$800/month
One-time
starting at
$2,400